 Map View | Interactive Meteosat
Loading application...
Map View | Interactive MeteosatWelcome to the Interactive METEOSAT (IM) webmapping application
This application allows you to compare meteorological observations with METEOSAT satellite imagery. If this help does not answer your questions, please take a look at the User manual and the IM case study.
The user interface is composed of several sections, each of which is described below:
Map
The map is the main component of this application. Apart from displaying geographic information, it contains a navigation tool that allows you to zoom and pan around the map. The map is refreshed after each action you perform. A progress bar is displayed while new information is loaded into the map.
Toolbar
The toolbar contains all the instruments needed for map navigation (zoom, pan, etc.). A tooltip is displayed when you move the mouse cursor over the tools. The far-right tool allows you to switch between Geostationary and Map viewers.

Tabs
Located on the left side of the application, the tab panels allow you to switch between Layers list Meteorological Measurement Info and Help section. The entire left panel can be collapsed to make more space for the map.

Layers
The layers list is used to determine the way the map is composed and displayed. IM layers are grouped in three categories: Base layers (you can only toggle between these layers), METEOSAT (you can show/hide these layers and define one active layer), Meteorological observations (you can show/hide these layers). Each layer has at least one associated checkbox. The checkbox allows you to control the map composition by turning on and off the layer visibility. You can adjust the transparency for the active layer using the transparency slider.
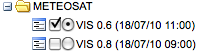
Important notice: For technical reasons, and due to the Eumetsat data policy, the Meteosat channels from 09:00 UTC are available in higher resolution only at 12:00 UTC. However, all but the VIS 0.8 and NIR 1.6 channels are available in lower resolution format soon after image acquisition. The VIS 0.8 and NIR 1.6 channels from the previous day are shown until 12:00 UTC when the higher resolution images from the current day are made available.
Transparency slider
The slider allows you to change the transparency of the active layer.

Legend
This section provides a legend for the meteorological symbols displayed on the map.
Info
When you click on a meteorological observation on the map, details of that observation appear in this section. Also, all the observations from the selected day are listed here.
Credits
This section mentions all the sources that have contributed to this application. This includes data sources, software, graphics and other contributions.
Calendar
The calendar allows you to display satellite images and meteorological observations from the archive.
Add observations
The observations management interface can be accessed by clicking on the upper-right link.

| Symbol color | Values (Celsius degrees) |
|---|---|
| < -25º | |
| -21º — -25º | |
| -16º — -20º | |
| -11º — -15º | |
| -6º — -10º | |
| -1º — -5º | |
| 0º — 4º | |
| 5º — 9º | |
| 10º — 14º | |
| 15º — 19º | |
| 20º — 24º | |
| 25º — 29º | |
| 30º — 34º | |
| 35º — 39º | |
| 40º — 44º | |
| > 44º |
Wind barbs point in the direction 'from' which the wind is blowing. In the case of the diagram below, the orientation of the wind barb indicates winds from the Northeast.
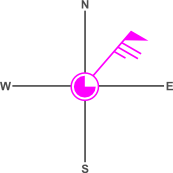
Each short barb represents 5 knots, each long barb 10 knots. A long barb and a short barb is 15 knots, simply by adding the value of each barb together (10 knots + 5 knots = 15 knots). If only a circle is plotted, the winds are calm. Pennants are 50 knots. Therefore, the last wind example in the chart below has a wind speed of 65 knots. (50 knots + 10 knots + 5 knots).
| Symbol | Values Knots | Values m/s |
|---|---|---|
 |
Calm | Calm |
 |
1 - 4 | 0.5 - 2 |
 |
5 | 2.5 |
 |
10 | 5.1 |
 |
15 | 7.7 |
 |
20 | 10.2 |
 |
50 | 25.7 |
 |
65 | 30.8 |
| Symbol | Meaning |
|---|---|
 |
Clear (0) |
 |
Scattered clouds (1/4) |
 |
Partly cloudy (1/2) |
 |
Mostly cloudy (3/4) |
 |
Overcast (4/4) |
| Symbol | Meaning |
|---|---|
| Good visibility | |
 |
Mist |
 |
Fog |
 |
Drizzle |
 |
Rain |
 |
Snow |
 |
Hail |
 |
Thunderstorm |
Daily temperature average, maximum and minimum values collected through GLOBE network. The symbol colors are correlated with the IM temperature legend. Important notice: The GLOBE observations are from the previous day.

Interactive METEOSAT (IM) is a web-based interactive application for the teaching of satellite meteorology in secondary schools. IM was developed by ASRC for the Eduspace website of the European Space Agency (ESA). IM is build entirely with standard compliant free and open source software.
Data
METEOSAT images
http://www.eumetsat.int
© EUMETSAT (Terms of use)
Google Maps
http://maps.google.com
© Google (Terms of use)
OpenStreetMap
http://www.openstreetmap.org
© OpenStreetMap (CC-BY-SA METEOSAT imageslicense)
Natural Earth
http://www.naturalearthdata.com
© Natural Earth (Terms of use)
Blue Marble
http://earthobservatory.nasa.gov/Features/BlueMarble
© NASA Earth Observatory (Terms of use)
Yahoo Weather
http://weather.yahoo.com
© Yahoo (Terms of use)
GLOBE
http://www.globe.gov
© GLOBE (Terms of use)
Software
OpenLayers
http://www.openlayers.org
© OSGeo (BSD license)
GeoExt
http://geoext.org
© GeoExt Community (BSD license)
ExtJS
http://www.sencha.com/products/js
© Sencha (GPLv3 license)
Proj4Js
http://proj4js.org
© OSGeo (GPLv3 license)
GDAL
http://gdal.org
© OSGeo (X11/MIT license)
Inkscape
http://inkscape.org
© Inkscape (GPLv2 license)
ImageMagick
http://www.imagemagick.org
© ImageMagick Studio LLC (Apache 2.0-style license)
Autotrim
http://phpmailer.worxware.com
© Fred Weinhaus (Free for free applications)
Mapnik
http://mapnik.org
© Artem Pavlenko (LGPL license)
TileCache
http://tilecache.org
© MetaCarta (BSD license)
QGIS
http://qgis.org
© OSGeo (GPL license)
Quantumnik
http://bitbucket.org/springmeyer/quantumnik/wiki/Home
© Dane Springmeyer (GPL license)
PHP
http://php.net
© PHP Group (PHP license)
Python
http://python.org
© Python Software Foundation (GPL license)
NumPy
http://numpy.scipy.org
© NumPy developers (BSD license)
Python Imaging Library (PIL)
http://www.pythonware.com/products/pil
© Secret Labs AB (Secret Labs AB license)
MySQL Community Server
http://www.mysql.com
© Oracle (GPL license)
PHPMailer
http://www.imagemagick.org
© Worx International Inc (LGPL license)
PHP MySQL Login Script
http://phpsense.com/php/php-login-script.html
© PHPSense.com (PHPSense.com license)
SimplePie
http://simplepie.org
© Ryan Parman, Geoffrey Sneddon and contributors (BSD license)
reCAPTCHA
http://www.google.com/recaptcha
© Google (Google license)
Graphics
Silk Icons
http://www.famfamfam.com/lab/icons/silk
© Mark James (CC-BY 3.0)
GNOME Desktop Icons
http://www.iconspedia.com/pack/gnome-desktop-2042/
© http://gnome.org (GPL 2.0)
Ideas
Peter Brøgger Sørensen, Jürg Lichtenegger and Roger Nay, the persons behind the original Interactive Meteosat idea.
GeoExt Examples
http://geoext.org/examples.html#examples
ExtJS Examples
http://dev.sencha.com/deploy/dev/examples
OpenLayers Examples
http://openlayers.org/dev/examples
Natural Earth Browser
http://earthatlas.info/naturalearth
GeoTribu
http://geotribu.net/applications/baselayers/index.php
Atlas of water and health
http://www.waterandhealth.eu
Nanaimo Map
http://maps.nanaimo.ca/nanaimomap
Click on the symbols (map or table bellow) to get more detailed information about meteorological observations.

